When something goes wrong and there isn’t a clear root cause, it can seem impossible to find, understand, and fix the problem. But now with VGS Observability, you can determine when, why, and how an atypical event happened.
VGS Observability is a metrics solution that helps organizations seamlessly analyze, visualize, and troubleshoot their integrations in a single connected experience. With this solution companies gain enhanced visibility into any incident, helping them become more resilient when an unexpected issue occurs.
Why use Observability?
By leveraging VGS Observability, you get deeper insights that increase transparency and improve debugging capability.
1. Visualize crucial metrics on a single platform
By integrating with the VGS Observability solution, you can stop switching between different tools looking for patterns in scattered data to figure out what went wrong. Observability surfaces the information needed to resolve issues or understand the effects of updates within your infrastructure in real time. You can combine and group data to get a fully connected view of the relationship between data from your integration health and the behaviors and outcomes you’re monitoring.
2. Gain full control over your metrics
VGS Observability can track dozens of metrics, helping you better understand and optimize your integration with VGS. With the ability to integrate VGS metrics with your own favorite tools, like your Grafana dashboard, you can also set your own alerts and receive notifications once something unexpected happens. As a result, you will be able to execute critical decisions faster and with the accurate insights needed for time-sensitive troubleshooting.
VGS Observability goes far beyond monitoring. While monitoring helps you find out when something happened, VGS Observability taps into the information you need to determine what exactly happened and how. It also provides a connected view of all data, enabling even deeper and clearer insights.

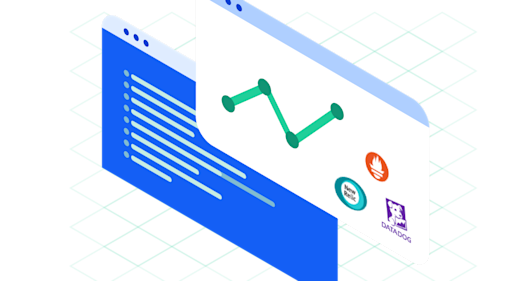
We provide the ability to set up a Prometheus endpoint on the VGS side, enabling you to pull metrics data into your preferred monitoring tools, such as Datadog, Grafana, or others, on your end.
What’s Next
As part of our efforts to continue to provide you with more insights into your integration with VGS, we have more in the works for the Observability product. Some items to watch for in the coming months include additional log metrics and integration types.
Most importantly, we want to hear about your observability and monitoring needs. Please contact us via observability@verygoodsecurity.com and share your thoughts with us today!
Head over to our docs to read more about the metrics provided and details on how to set up your integration.


